Portfolio Construction & Diversification
By: Sofie Korac, Principal Adviser
Prudentia Financial Planning Pty Ltd
When it comes to investing, I’m sure you have heard of the saying “don’t put all your eggs in one basket!” What does this mean and how does this translate to creating a diversified portfolio?
A diversified portfolio means investing into a range of different assets and asset classes that have different performance and risk characteristics. In addition to this, the assets need to perform differently at different points in the market cycle.
The below chart shows a technical representation of the correlation between different asset classes:

Source: Lonsec
How to interpret the numbers:
+1.00 = 100% positive correlation between two assets i.e. performance of both assets move in the same direction over a period of time. For example, if the value of one asset goes up, so does the other. Likewise, if the value of one asset goes down, so does the other.
-1.00 = 100% negative correlation between two assets i.e. performance of the two assets move in the opposite direction over a period of time. For example, if the value of one asset goes up, the value of the other asset goes down, and vice versa.
0.00 = no correlation between two assets i.e. sometimes the value of the two assets move in the same direction and sometimes in opposite directions. There is no relationship between the performances of the two assets.
The closer the number is to +1, the greater the positive correlation. The closer the number is to -1, the greater the negative correlation.
Note: Correlation does not relate to actual performance. A positive correlation does not mean two investments perform the same, it just means they move in the same direction.
In a diversified portfolio, you ideally want there to be little or no correlation between the various investments used. However, in reality it can be difficult to achieve this as correlations between asset classes don’t stay static. The correlation between two assets may be neutral or negative during normal market conditions, but may become more highly correlated during a market crisis.
We saw this last year when bonds and equities both lost value over the same time period. These two asset classes normally have negative correlations. Bonds are generally used to help protect a portfolio when equities fall in value during a bear market. When there is an economic downturn, interest rates usually fall which is good for bonds and helps stimulate the economy. Last year however, we say rising inflation leading to rising interest rates and a slowing economy resulting in falling asset prices within bonds, equities and property. The perfect storm you could say.
But this year, it seems to have reversed. Both bonds and equities have made a strong recovery. Some assets have recovered better than others, while some have had a further decline in value.
You might then ask, why don’t we just invest in the best performing assets?
We know from experience, that past performance does not always equal future performance. The chart below shows the performance of different asset classes over the years.
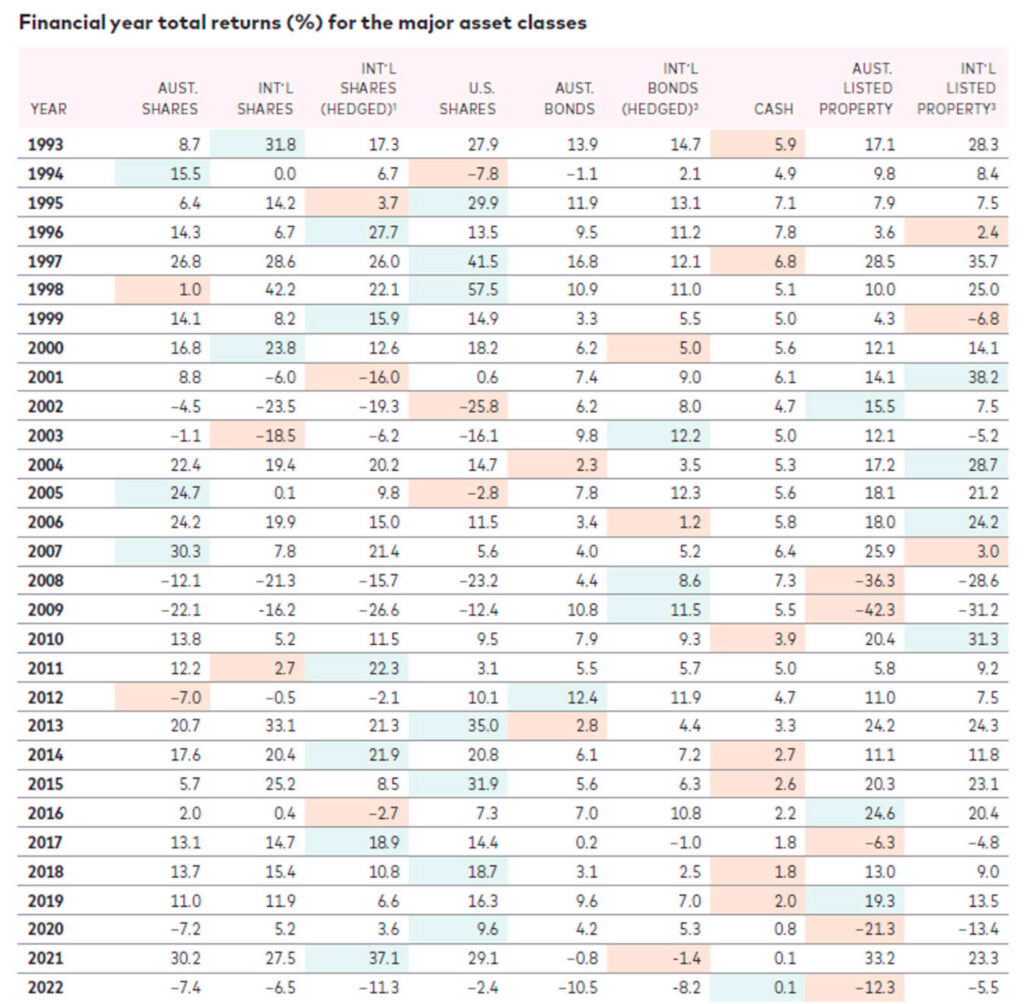
Source: Vanguard
You can see on the last row that the 12 months to 30 June 2022 was an unusual year in that all asset classes fell in value including cash, if you take into account inflation.
It is almost impossible to predict future performance of an asset class consistently over time. Having a portfolio that has a broad level of diversification means we don’t have to second guess the market. Regular re-balancing between the various assets ensures you take advantage of market movements when they occur and to maintain your desired level of risk within the portfolio. Regular investing of cash also ensures your wealth continues to grow and compound over time.
Successful investing depends not on market timing or picking the winning investment, but rather on broad diversification, keeping a long-term perspective and the discipline to stay invested when things get tough.
More Articles

Most Reliable Car Brands in 2026
Check out which car brands are the most likely to stay on the road and not cost you a fortune to...

Super versus trusts: What is the best option with Div 296?
Super used to be clearly the “best” option due to low tax rates but the increasing complexity of things...

AI use needed with proper safeguards
The SMSF Association has suggested practitioners servicing the sector must equip themselves with more than...

Thinking of establishing an SMSF? Don’t skip reading the rules
As the establishment of new SMSFs continues to rise, the ATO is reminding potential trustees to ensure they...

Are downsizer contributions losing steam?
Tax Office data shows fewer people used its super scheme in 2024-25 . Introduced in 2018, the home...

Investment and economic outlook, February 2026
latest forecasts for investment returns and region-by-region economic outlook . Australia A rate...

Coercive control in SMSF becoming a hot issue
AFCA is anticipating there will be more focus on coercive control and elder abuse going...

What to look for when choosing a financial adviser
Here's how to find a financial adviser who can provide the right support for you . We believe...
Heathmont Financial Services Pty Ltd (ABN 68 106 250 104) trading as Heathmont Financial Services is a Corporate Authorised Representative (No. 262098) of Knox Wealth Management Pty Ltd (ABN 74 630 256 227), Australian Financial Services Licence Number (AFSL) 513763.
Julian McGoldrick is an Authorised Representative (No. 262098) of Knox Wealth Management Pty Ltd AFSL 513763.