What’s your risk profile?
Your attitude to risk is one of the most important factors to consider when it comes to investing.

How much risk can you tolerate?
Your attitude to risk is one of the most important factors to consider when it comes to investing.
This is because growth assets, like shares and property securities, tend to have more volatile returns over the shorter term but they do have the potential to produce higher long-term returns.
Assets like bonds and cash are considered lower risk and less volatile but they generally do not have the same potential for similar high returns over the long term.
Understanding whether you have an appetite for risk and where you are on the risk spectrum is often the first step on an investment journey.
Consider your timeframe into your risk profile
Generally, the longer you have to invest, the more growth assets you can include in your portfolio.
The graph below illustrates how the ups and downs of investment markets tend to even out and the gap between the highest and lowest returns closes over time. For example, holding international shares for just one year an investor might experience a return of over 40% or lower than -30%. Over longer time periods, however, these wild swings tend to smooth out.
This is why it is important to consider your timeframe for your investment goal when choosing your investments. For instance, investing funds you're earmarking for a home you want to buy in three years is very different to funds you're setting aside for your retirement in thirty years. The risk tolerance for the former is much lower because of the shorter time frame.
Risk of major asset classes
Range of returns over 1, 5 and 10 year periods (1 January 1990 – 30 September 2017)
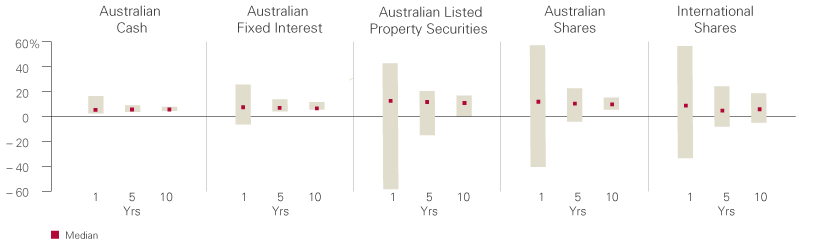
Note: Assumes 100% reinvestment of distributions without any considerations of fees.
Source: Vanguard calculations using data from Morningstar Direct.
Vanguard Diversified Funds: example of investor risk profiles
Most fund managers offer diversified funds where the mix of investments, or asset allocations, are aligned with a range of investor profiles and their appetite for risk.
Let's look at Vanguard Diversified Funds as an example. There are four funds – conservative, balanced, growth and high growth.
Vanguard Diversified Funds: income/growth allocation
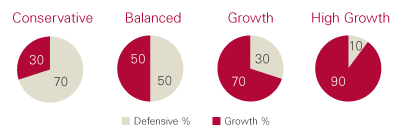
They aim to provide long-term investment returns that match your desired level of risk. The allocations to defensive assets (bonds and cash) and growth (shares and property securities) are the main factors influencing the risk/return profiles of the Diversified Fund portfolios.
Vanguard's Diversified High Growth Fund invests 10 per cent of the portfolio in income or defensive assets (bonds) and 90 per cent in growth assets (shares), and is suited to those seeking capital growth and those with a higher risk tolerance and longer investment time frame.
However, if the thought of your investments going up and down is going to keep you awake at night, you may feel more comfortable choosing a more conservative or balanced investment approach, where there is a higher allocation to defensive assets.
Although taking no risk can be one of the biggest risks of all, if you invest all your money in cash, inflation and costs can erode your investment returns and purchasing power over time.
Written by
Vanguard
29 Jun, 2021
vanguard.com.au
More Articles

The evolution of the world’s languages
Check out the evolution of the world's most spoken languages from 2500 BC to...

Adequate retirement savings misjudged
Association of Superannuation Funds of Australia (ASFA) research has shown individuals across the country are...

Record SMSF growth driven by digital access
Record SMSF growth driven by AI and digital tools, but admin and compliance challenges...

The SBSCH will close from 1 July 2026
The ATO is warning employers not to use the small business super clearing house (SBSCH) for any further...

Rules apply to gifting in superannuation
Australia’s age pension gifting rules are again under scrutiny as advisers warn that retirees are...

Complications of maintaining two cost bases in Div 296
According to BT technical consultant Matt Manning, the Division 296 cost base reset requires SMSFs to maintain...

investment and economic outlook 2026
Our latest forecasts for investment returns and region-by-region economic outlook . Economic...

What the Payday Super changes mean for your retirement
Significant reforms to the Australian superannuation system are about to take effect and could help people...
Heathmont Financial Services Pty Ltd (ABN 68 106 250 104) trading as Heathmont Financial Services is a Corporate Authorised Representative (No. 262098) of Knox Wealth Management Pty Ltd (ABN 74 630 256 227), Australian Financial Services Licence Number (AFSL) 513763.
Julian McGoldrick is an Authorised Representative (No. 262098) of Knox Wealth Management Pty Ltd AFSL 513763.